Antarctic sea ice hits minimum of 2.58 million square kilometres
According to the National Snow and Ice Data Center (NSIDC) in Boulder, the seasonal minimum was reached on February 26, 2026; it ranks as the 16th lowest in 48 years of satellite records, but is 260,000 km2 below the 1981-2010 average.

The National Snow and Ice Data Center (NSIDC) in Boulder, Colorado, announced that Antarctic sea ice in 2026 reached a seasonal minimum of 2.58 million square kilometres on February 26, the 16th lowest on record across 48 years of satellite measurement. While the result is much closer to the long-term average than in the previous four years, it is still 260,000 square kilometres below the 1981-2010 average, an area larger than the whole of Great Britain. The figure is 730,000 square kilometres above the absolute low recorded on February 21, 2023.
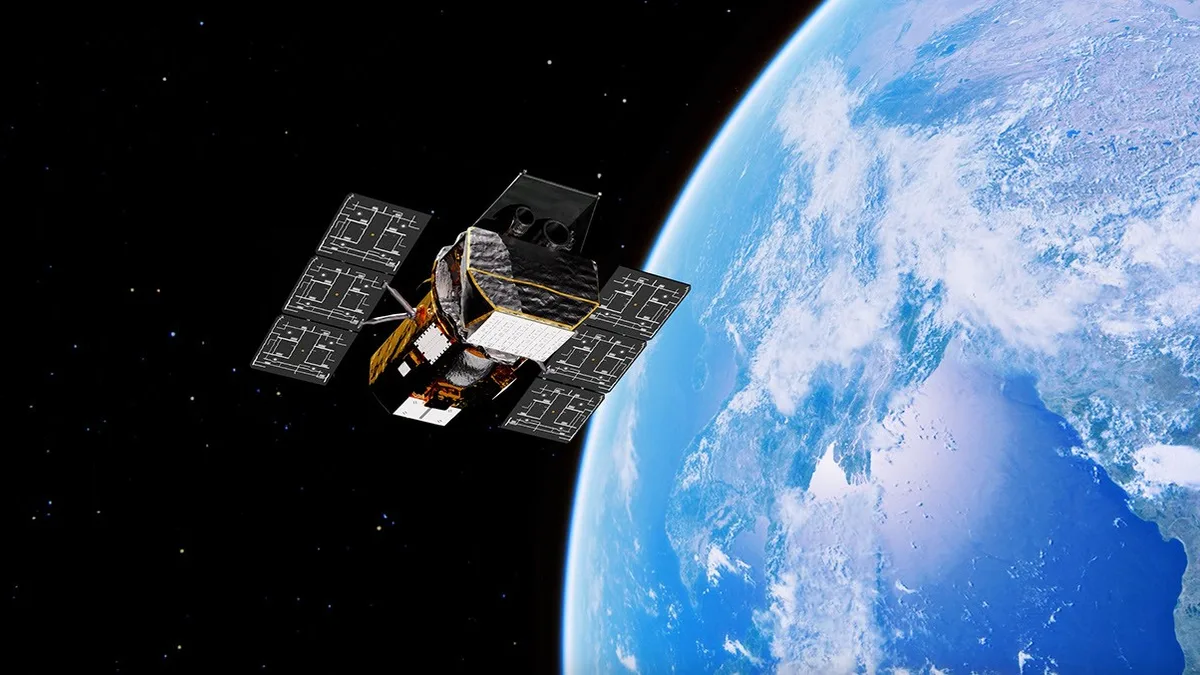
Antarctic sea ice has been tracked continuously since 1979 by sensors on US Defense Meteorological Satellite Program (DMSP) satellites and NASA instruments, providing the longest homogeneous record of one of the key climate variables. NSIDC is the leading global institution processing and publishing these data. According to the published report, after four consecutive years of extreme Antarctic sea ice lows, the return towards values closer to average should not be read as a sign of recovery, but as expected statistical noise within a trend that varies year to year across a wide range.
Ted Scambos, a senior researcher at the University of Colorado’s Cooperative Institute for Research in Environmental Sciences (CIRES), said that for much of the year Antarctic sea ice was well below the daily average, but in January and February strong southerly winds pushed the ice outward in the Weddell Sea region, partly contributing to a larger than expected minimum. Walt Meier, the NASA NSIDC scientist, added that “this year’s return to less extreme conditions is not unexpected given the large year-to-year variation in Antarctic sea ice across the satellite record.”
What the data do NOT confirm
Several caveats apply before drawing conclusions. First, Antarctic sea ice is not the same as the Antarctic ice sheet. Sea ice forms seasonally on the ocean surface and its year-to-year variation is tied to atmospheric and oceanographic processes, not to a direct climate trend at the same magnitude as continental ice. Second, the 2026 return to more typical values does not change the fact that the 2022-2025 period set record lows, nor does it refute the broader weakening trend of Antarctic ice documented since the early 2010s.
Third, the mechanisms governing Antarctic sea ice are considerably more complex than those in the Arctic. Antarctica has no dominant long-term retreat trend like the north; instead it shows broad year-to-year variability that was mostly positive until 2016 and has been predominantly negative since. According to the IPCC scientific consensus in the Sixth Assessment Report, weakened Antarctic ice is linked to oceanic warming on the Circumpolar Current, but the causal mechanisms are still being researched.
Practically, NSIDC notes the February figure is preliminary. Persistent melt or strong continental winds could in theory have lowered the final recorded value, but ice reformed across March and April, confirming February 26 as the seasonal minimum. The next important date is the winter maximum, traditionally recorded in late September in Antarctica, which will give the first indicator of whether 2026 continues the return to average values or stands as an isolated case.
Globally, Antarctic sea ice serves several important climate functions. First, it reflects sunlight back into space through the albedo mechanism, cooling the planet. Less ice means more heat absorbed by the ocean, which further accelerates melting, a classic positive feedback. The second important role is in producing so-called Antarctic Bottom Water, a dense, cold, salty mass that sinks and drives the global thermohaline circulation. According to data from the Australian Antarctic Program, this circulation has slowed by around 30 percent over the past two decades, with long-term consequences for the transport of heat and nutrients through deep ocean layers and, by extension, regional climate patterns globally.