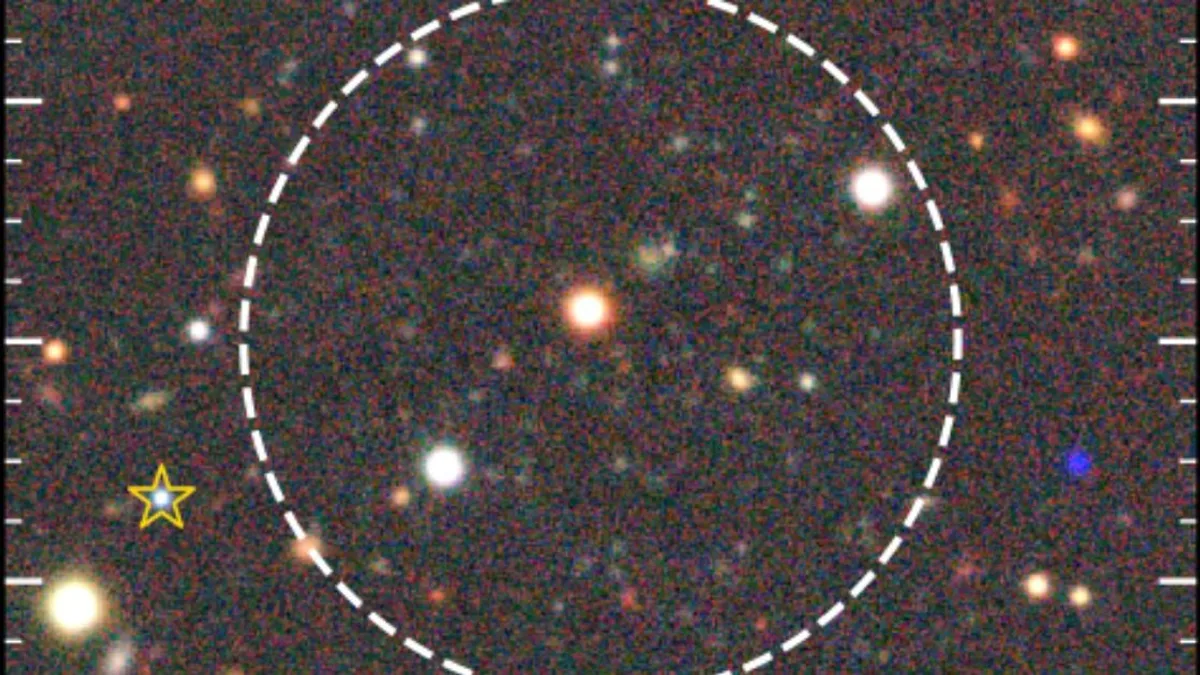
LOFAR radio image of ELAIS-N1 shows 62,916 sources
A team from Leiden University has released an image of a 6.25 square degree field, 20 times sharper than the previous most sensitive LOFAR image of the same patch of sky.
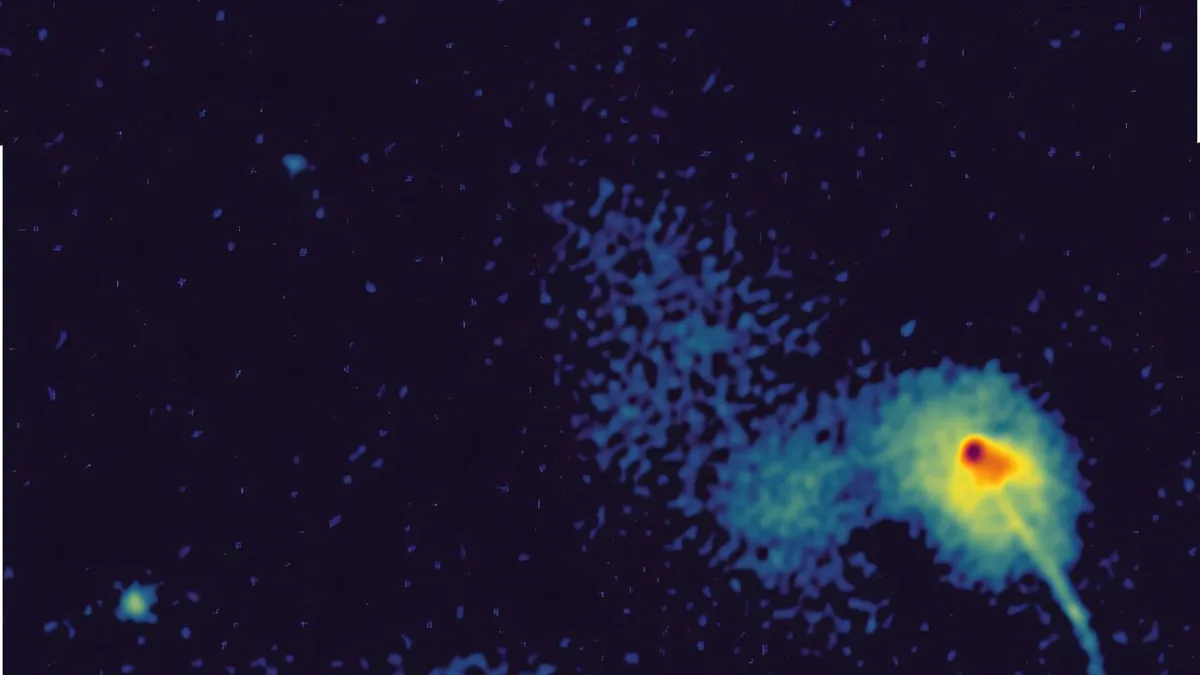
An international team led by Leiden University has presented the sharpest and most sensitive low-frequency radio image of the sky ever made. The snapshot from the LOFAR (Low Frequency Array) antenna network shows the ELAIS-N1 field in the northern sky, and in it the team counted 62,916 unique radio sources. The paper was posted to the arXiv preprint server on November 4 and has been accepted for publication in Astronomy & Astrophysics, while the Netherlands Research School for Astronomy issued a press release on the results.
How big is the field, and what is in it?
ELAIS-N1 is a well-studied part of the northern sky, known for its many faint, distant galaxies. According to the paper, the imaged field measures 2.5 by 2.5 degrees, or 6.25 square degrees. The press release describes that area as about 25 times the size of the full Moon on the sky.
The figure of 62,916 sources comes from the scientific paper, while the press release rounds it to “almost 63,000.” The catalog was built by combining the new images with previously published deep LOFAR images at a resolution of 6 arcseconds.
The observation was led by a team from Leiden University with the participation of the ASTRON institute. The paper’s first author is J. M. G. H. J. de Jong. It is titled “Pushing the frontiers of low-frequency radio astronomy: An ultra-deep sub-arcsecond LOFAR image of ELAIS-N1” and is filed as arXiv 2611.06152.
How much sharper is the image than the previous one?
The authors say the new image is 20 times sharper than the most sensitive earlier LOFAR image of the same part of the sky, which had a resolution of 6 arcseconds. At the center of the field the angular resolution is 0.33 by 0.39 arcseconds, and averaged over the whole area it is 0.36 by 0.45. The press release compares this to telling coins apart from about 10 kilometers away.
Sensitivity at the center is 5.3 microjanskys per beam for a point source, and 7.4 microjanskys averaged over the area. The observations cover a frequency band from 115 to 168 megahertz. The authors rate the images as the deepest radio images below 1.28 gigahertz to date.
Source positions were checked against 95 quasars from the Gaia catalog. The offset is minus 3 plus or minus 27 milliarcseconds in right ascension and 2 plus or minus 17 in declination.
How was 400 terabytes processed?
The data were collected over 200 hours and take up 400 terabytes, and the full-resolution image has 8 billion pixels. For years, processing at this level of detail was not feasible. Improved calibration and data reduction methods, developed by the team and its collaborators, have cut the cost of processing by more than a factor of ten over the past few years.
Jurjen de Jong, a postdoctoral researcher at Leiden Observatory and ASTRON who led the study, explained this in the press release:
“The entire dataset could be processed on Spider, a high-performance data processing platform maintained by SURF in the Netherlands, in just a few months.”
The work was therefore done on a Dutch computing platform, not on a purpose-built system next to the telescope.
What does the image show?
The two most common groups of sources are active galactic nuclei and small galaxies that are forming stars. Active nuclei are powered by supermassive black holes, which can also launch powerful jets, and LOFAR records these well because it is sensitive to faint, extended emission. Radio waves pass through the dust that hides star formation from optical and infrared telescopes, so radio images show that process in distant galaxies without obstruction.
In lower-resolution images, distant galaxies and the jets driven by black holes look like shapeless blobs. It is hard to say how many galaxies or components they consist of, or whether the emission comes from a jet or from star formation across the whole galaxy. In the new data the components are easier to separate, and large jets can be followed in detail.
Reinout van Weeren, an assistant professor at Leiden Observatory and a co-author of the paper, said in the press release:
“With such a sharp and sensitive view of our sky at low radio frequencies, we get a new window to study how these radio jets act on their surroundings and how they evolve over cosmic time.”
What comes next for the data and the telescope?
The data are freely available to the astronomical community. Most of the scientific value is expected to come from combining them with images of the same field in optical, infrared and X-ray light, which makes it possible to determine properties such as the distance and mass of each source.
The authors also present the work as proof of what the LOFAR2.0 upgrade can do, which ASTRON is carrying out with European partners. De Jong argues that the image shows how LOFAR2.0 will stay competitive even when the Square Kilometre Array observatory, now being built in South Africa and Australia, comes into operation.
What does this not prove?
The paper is so far available as a preprint, and while it has been accepted for publication, the peer-reviewed version has not yet appeared. The figures on resolution, sensitivity and number of sources come from the authors themselves. The image alone says nothing about the nature of individual sources: to know which source is a black hole jet and which is a galaxy with stars being born, additional observations at other wavelengths are needed. The assessment that LOFAR2.0 will stay competitive in the SKA era is the researchers’ estimate, not a result of this measurement.